Miscellaneous Infographics
A selection of random infographics, visualizing a school’s MCAS results, visualizing a doctor’s AIDS treatment research, and a set of visuals developed while teaching graphic design to 6th graders.
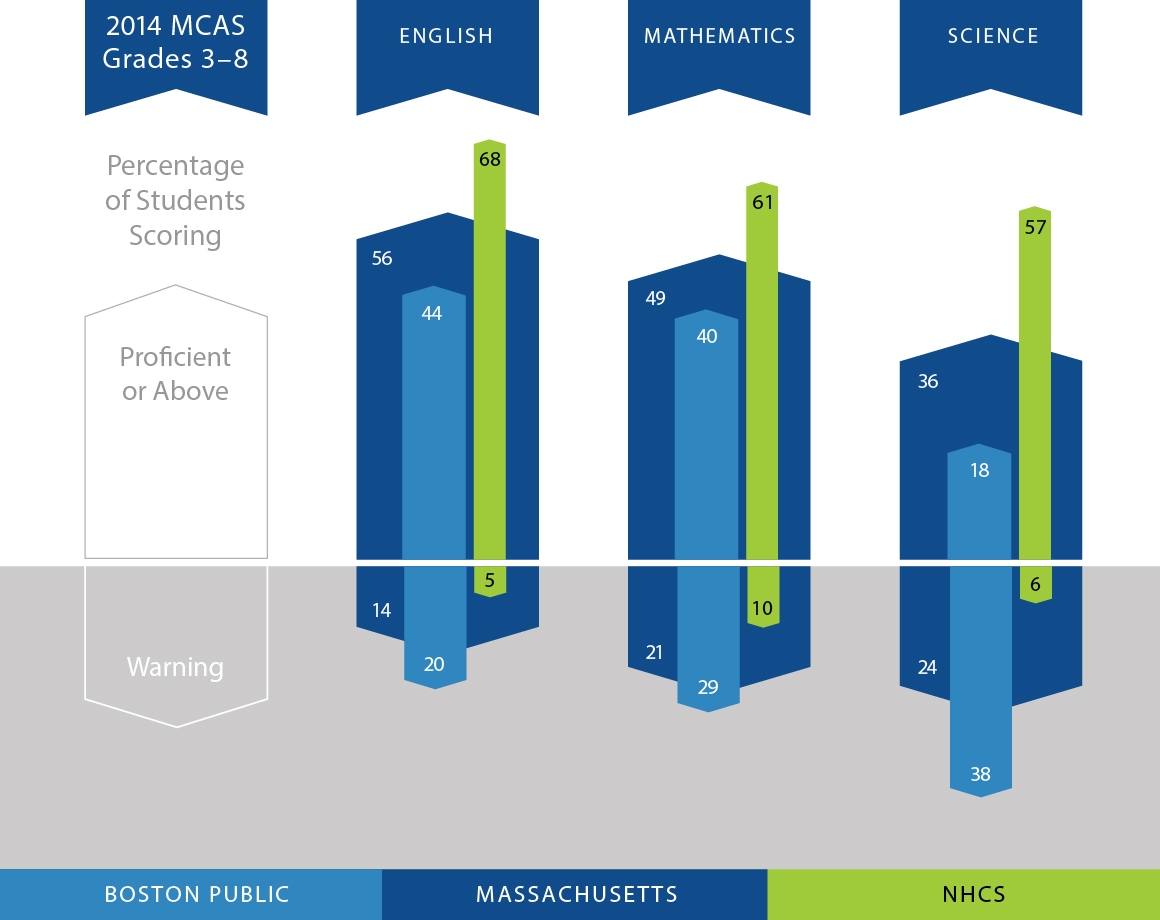
NHCS MCAS Results
Visualization of a schools MCAS results in comparison to Boston public schools, and all MA public schools. Used by the school in its annual reporting.
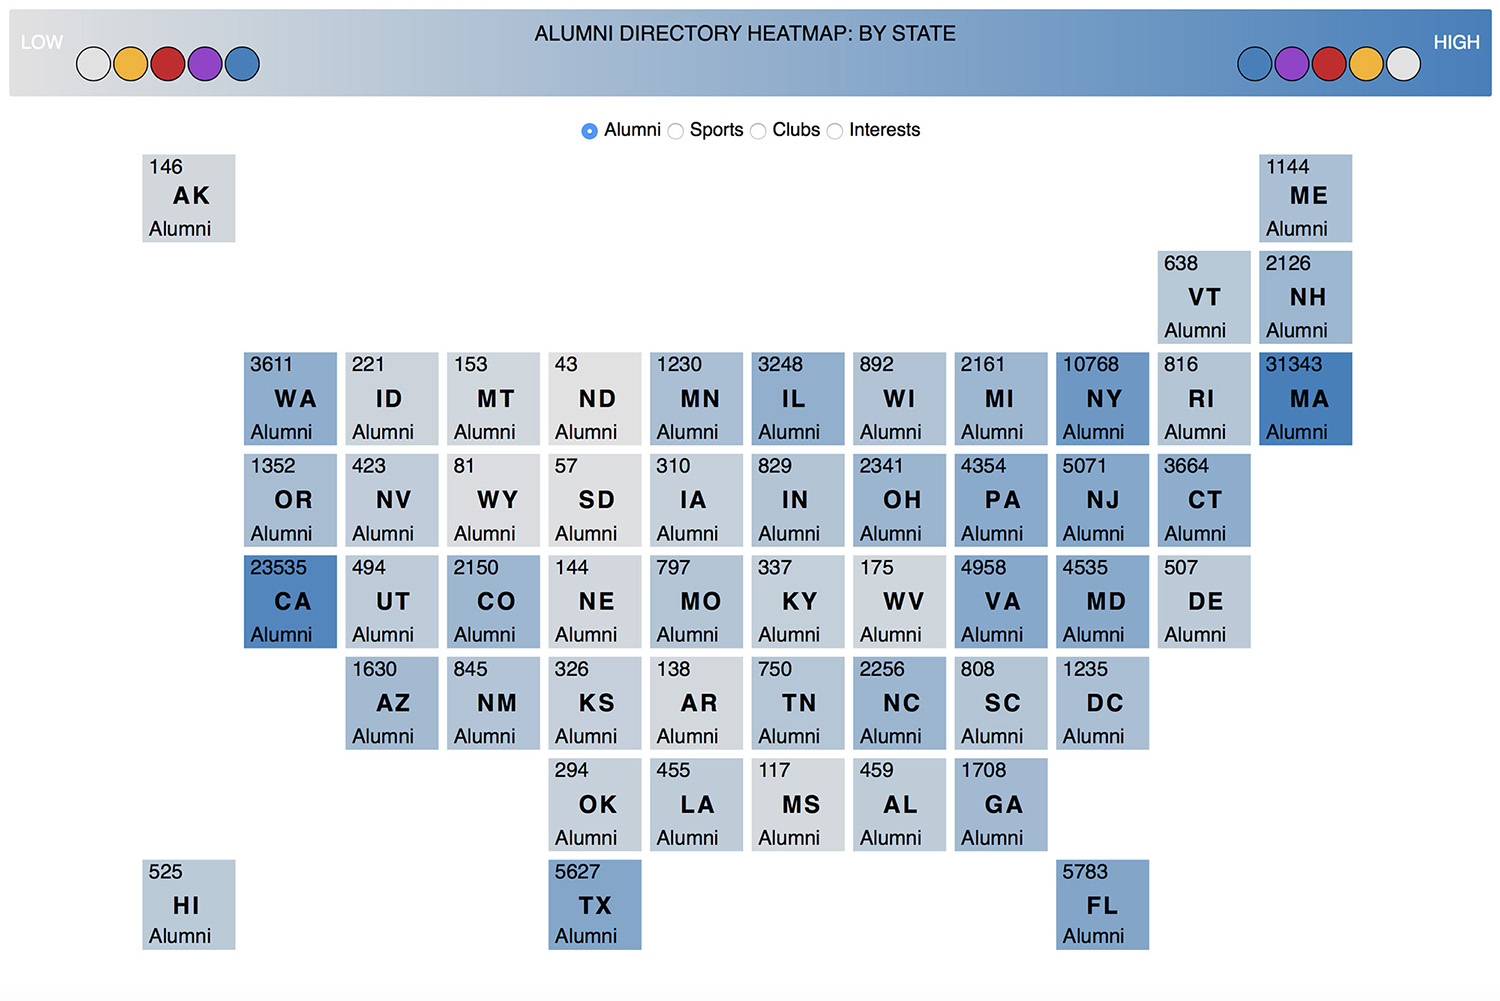
Digital Heat Map
An exploration of SVG and Javascript to visualize data in a CSV format. The periodic table version of the US is created in Illustrator and exported to SVG code. Data from the CSV file is mapped to the SVG assets, color is assigned from a scale based on the data. Radio buttons re-map data from different columns in the spreadsheet. Color buttons are created to allow control over the color scale. This employs CSS transforms best viewed with Safari and/or Chrome.
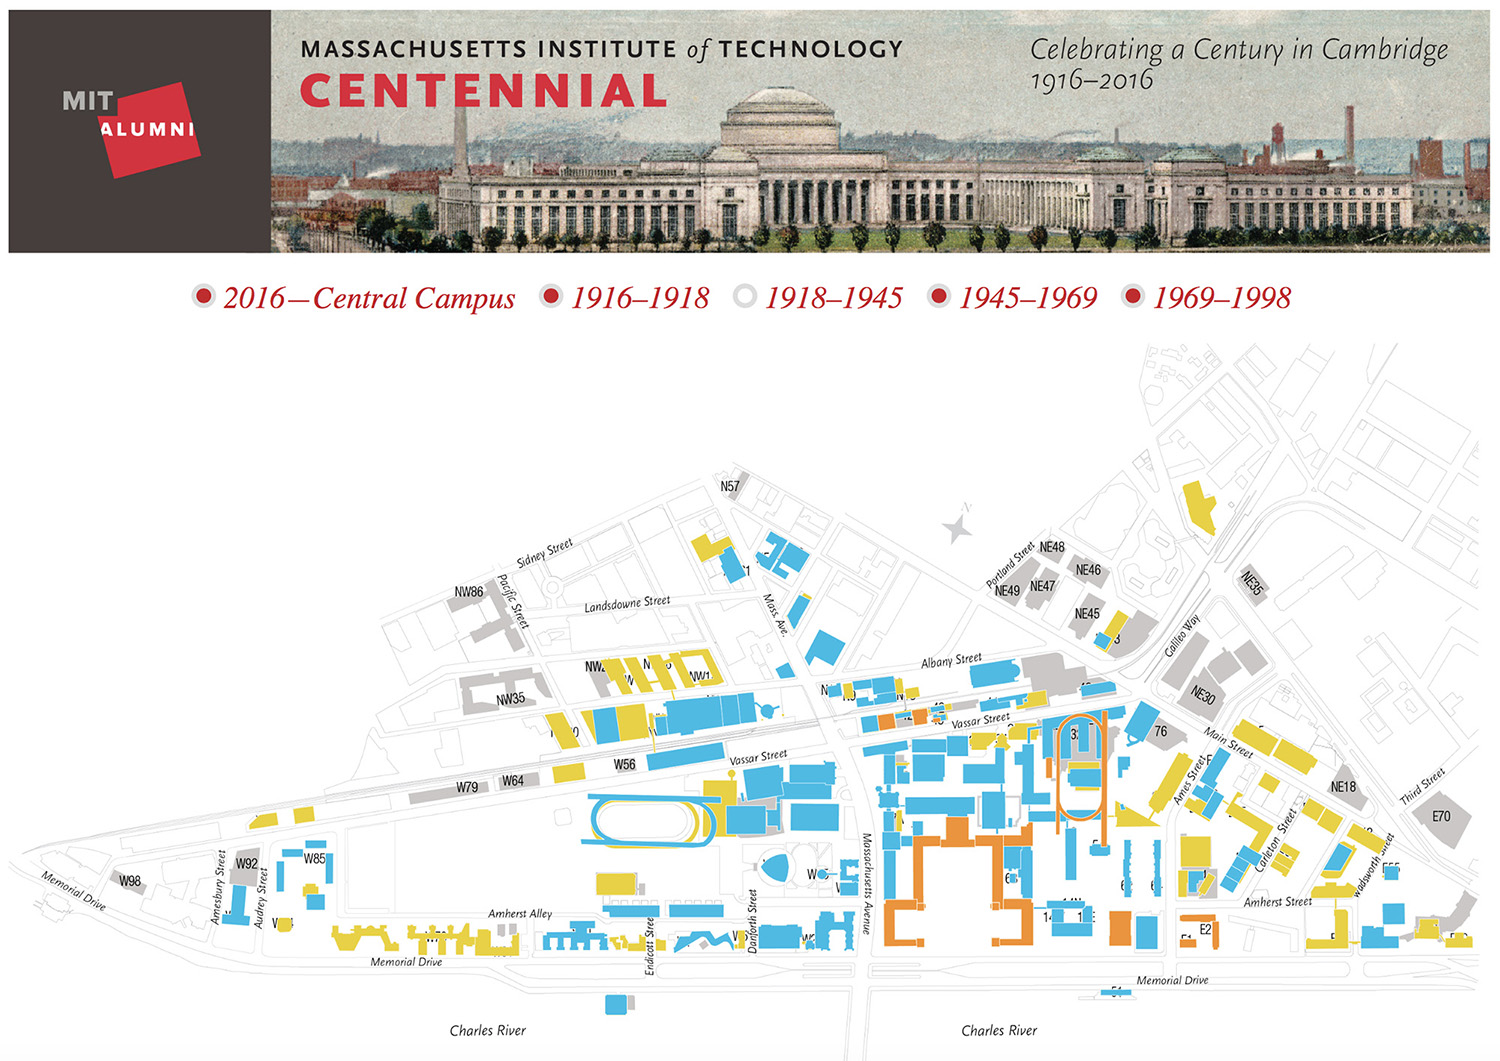
MIT Centennial Map
100 years of MIT
A digital version of a print piece to celebrate 100 years since MIT moved to Cambridge. Vectors were created from maps of the campus from various decades and aligned to show how the campus changed over the years. Checkboxes, styled as radio buttons control turning each layer on/off.
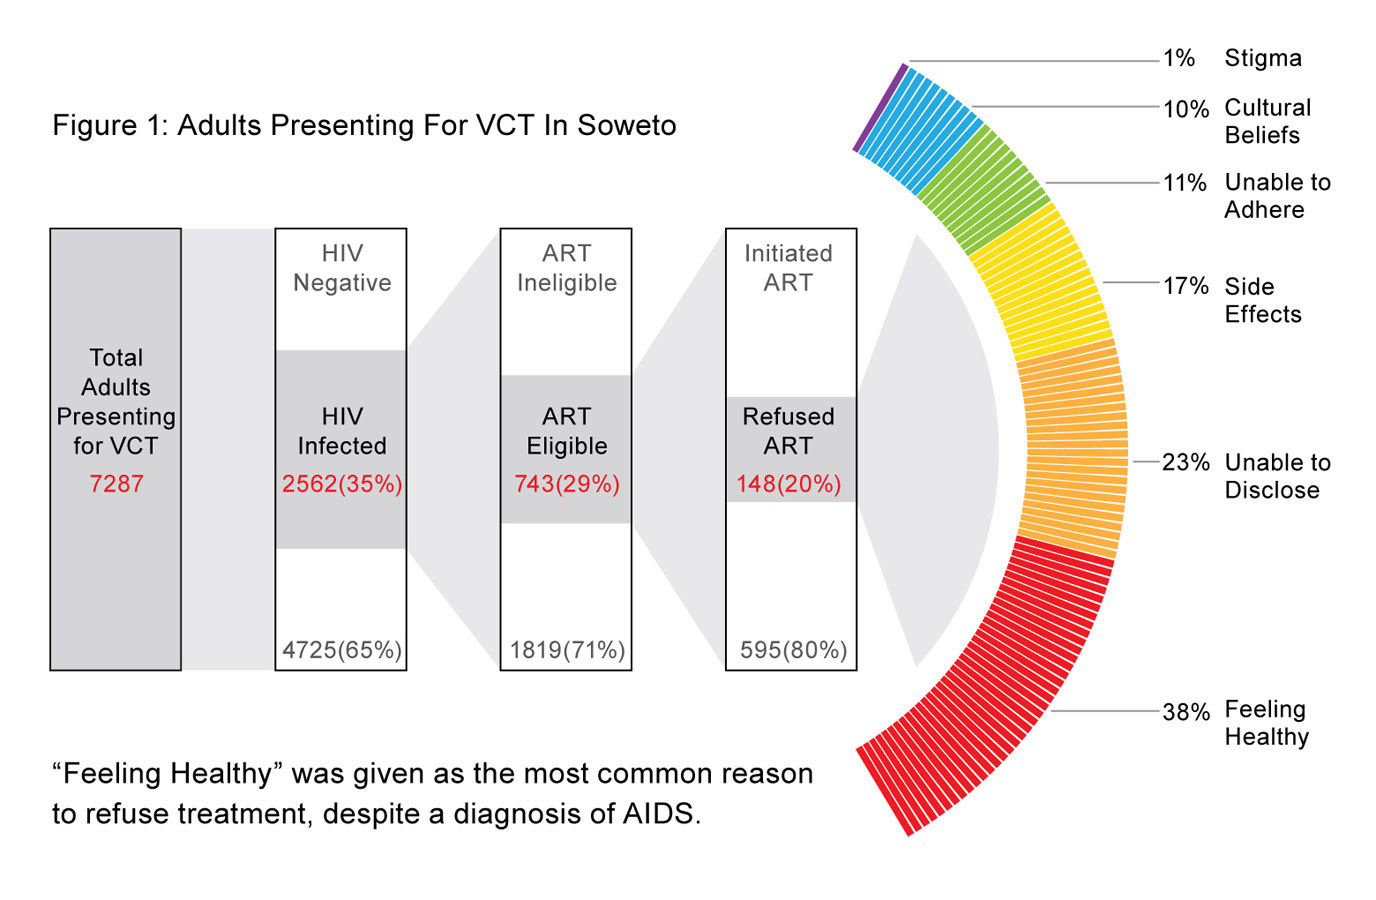
Treating AIDS in Soweto, Africa
Visualization of how a population is tested for AIDS, qualified for treatment, and the reasons they then give to not proceed with treatment. Used in a successful research grant proposal.
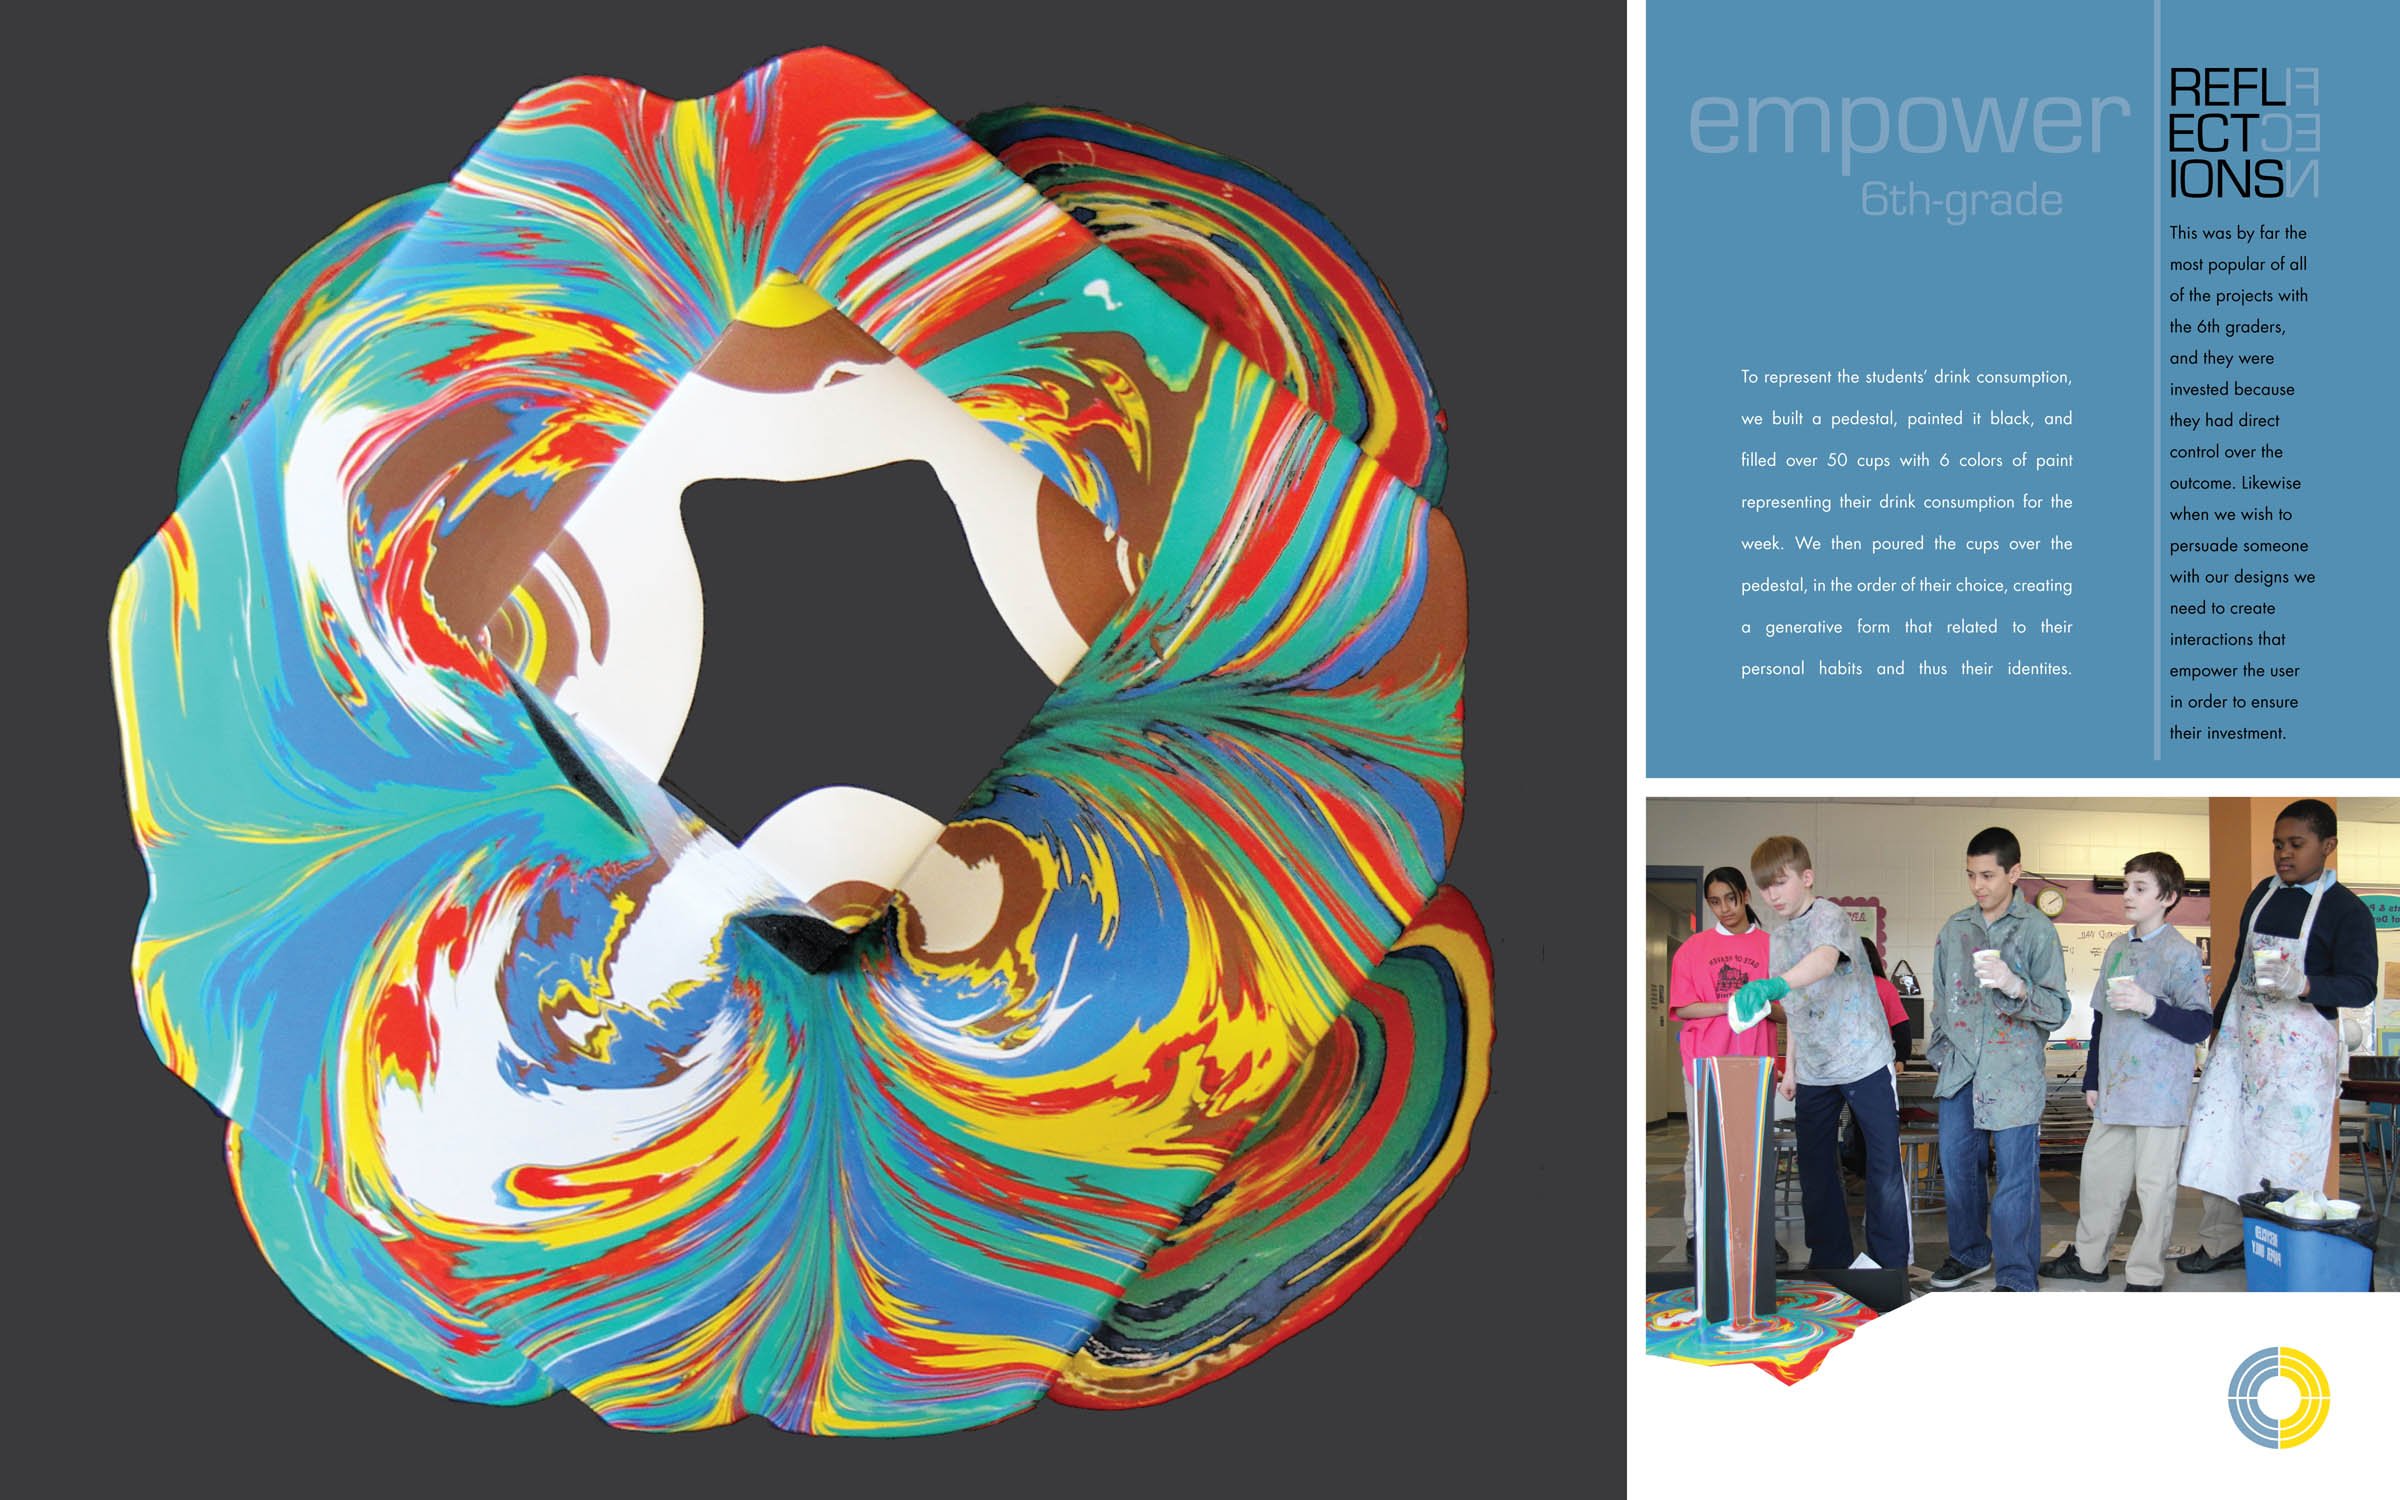
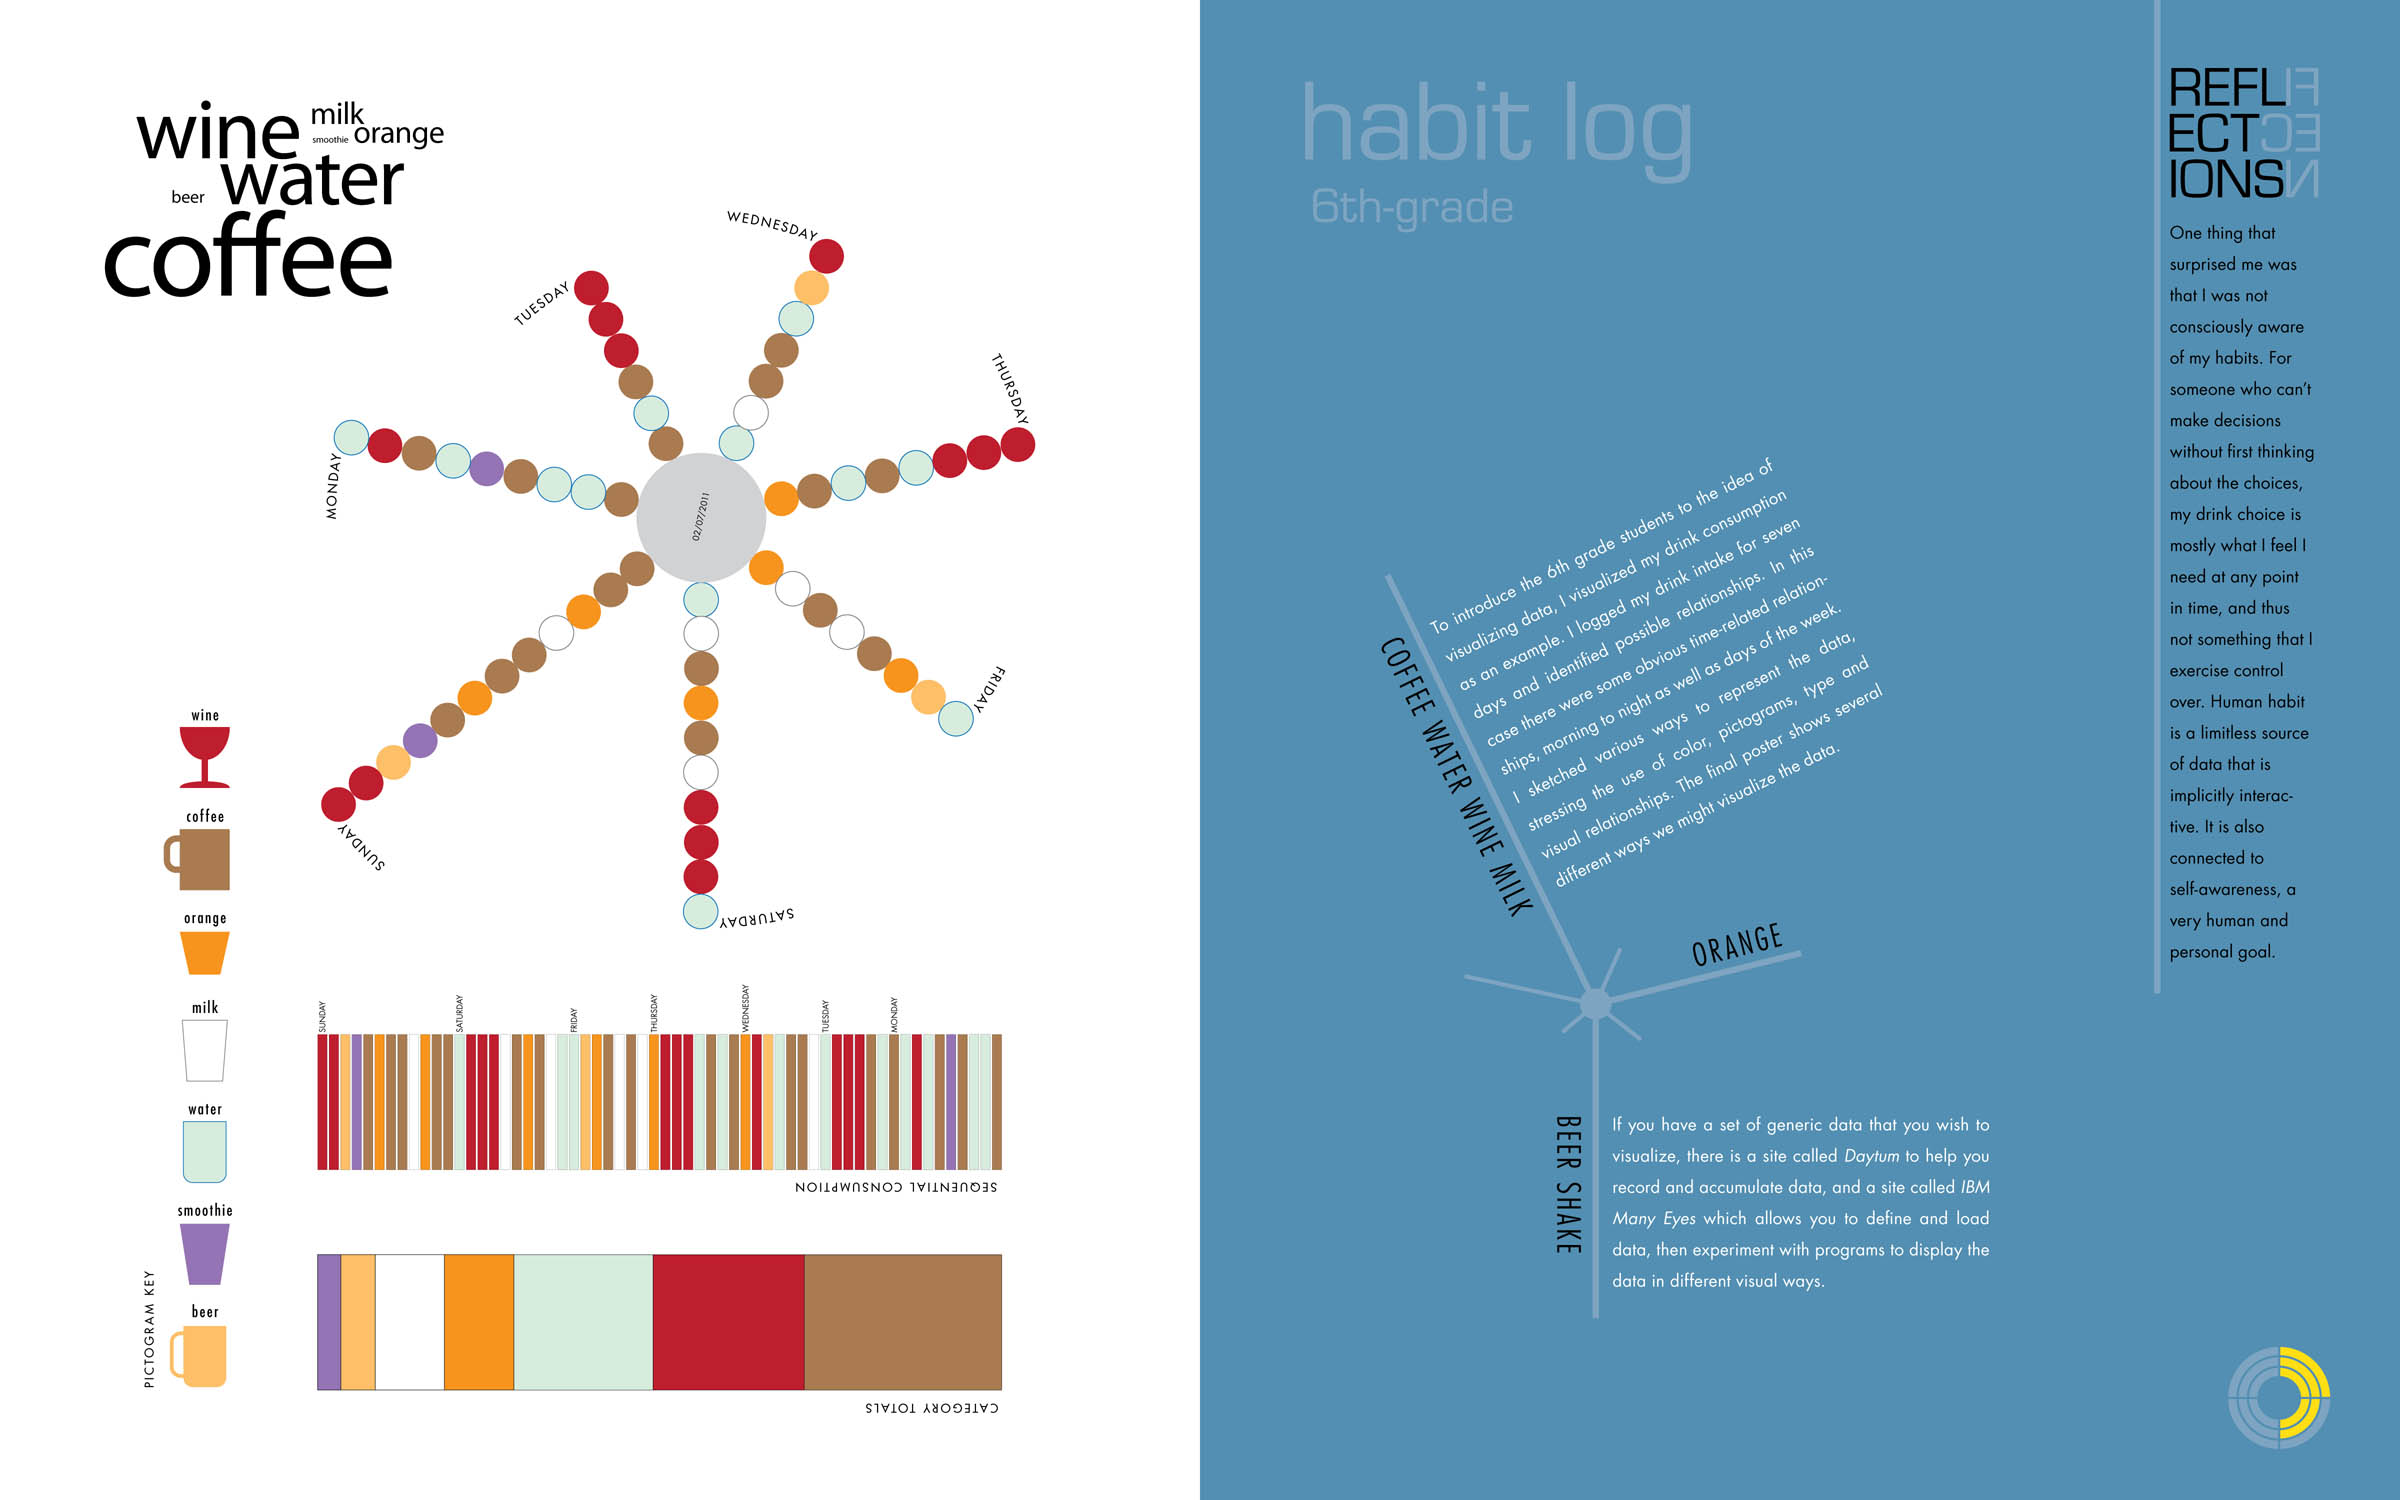
Teaching infographics
to 6th-grade students
—part 1
Visualization of what I drank for an entire week to demonstrate various ways of representing the same data. Part of my thesis prestudy phase.
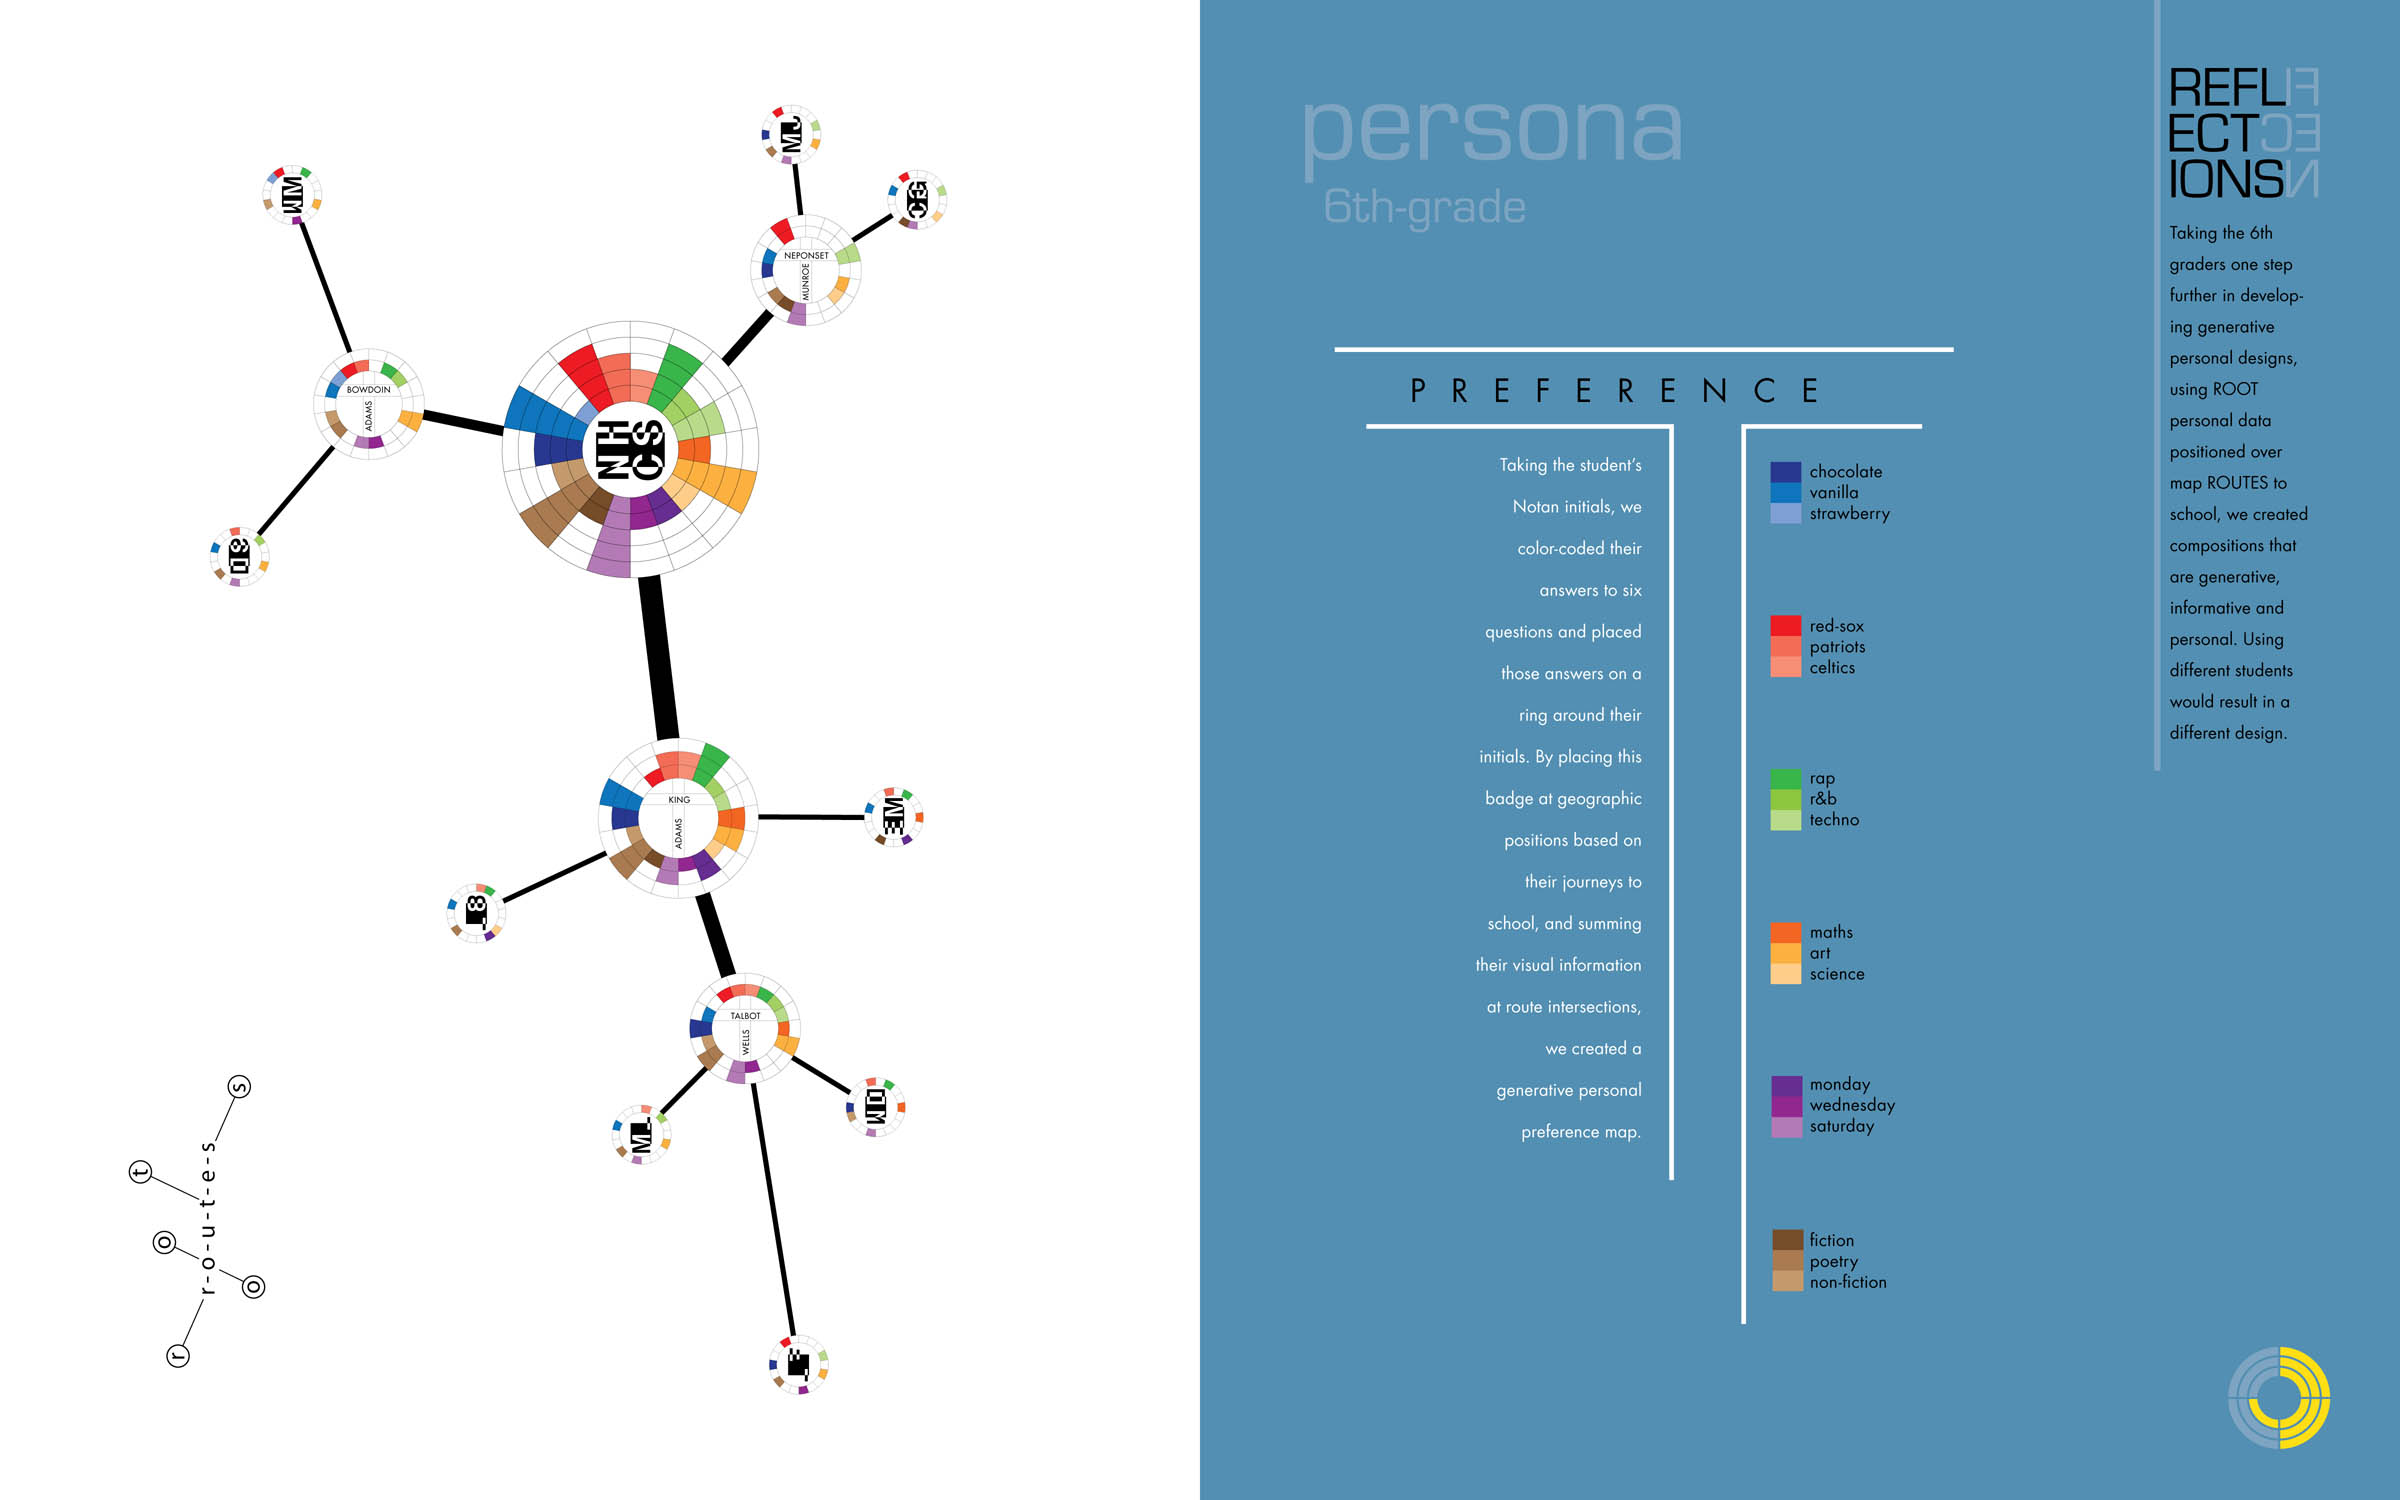
Teaching infographics
to 6th-grade students
—part 2
Visualization of what students answered to 6 questions of preference, mapped to their geographical route to school, to demonstrate what a generative form is, and how personal data can be useful to companies.
Teaching infographics
to 6th-grade students
—part 3
An abstract visualization of what students drank for an entire week, moving from 2 to 4 dimensions, and making it interactive.