Miscellaneous Infographics
A selection of random infographics, visualizing a school’s MCAS results, visualizing a doctor’s AIDS treatment research, and a set of visuals developed while teaching graphic design to 6th graders.
Digital Heat Map
An exploration of SVG and Javascript to visualize data in a CSV format. The periodic table version of the US is created in Illustrator and exported to SVG code. Data from the CSV file is mapped to the SVG assets, color is assigned from a scale based on the data. Radio buttons re-map data from different columns in the spreadsheet. Color buttons are created to allow control over the color scale. This employs CSS transforms best viewed with Safari and/or Chrome.
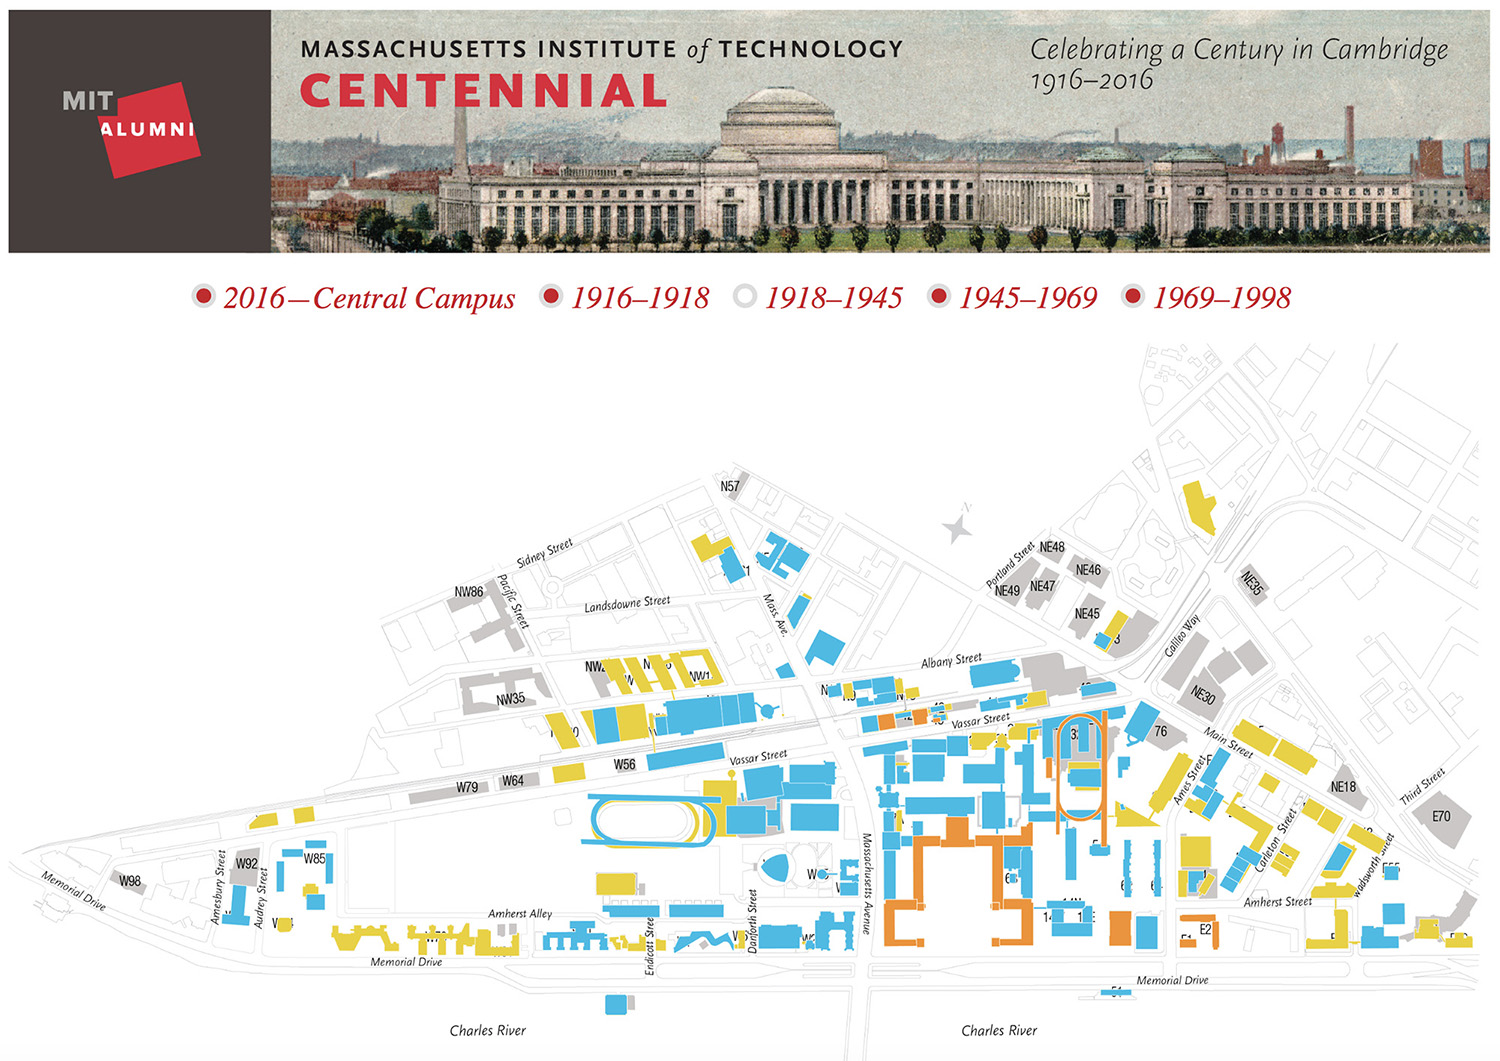
MIT Centennial Map
100 years of MIT
A digital version of a print piece to celebrate 100 years since MIT moved to Cambridge. Vectors were created from maps of the campus from various decades and aligned to show how the campus changed over the years. Checkboxes, styled as radio buttons control turning each layer on/off.


